Question #6402754Single Choice
Math
Question
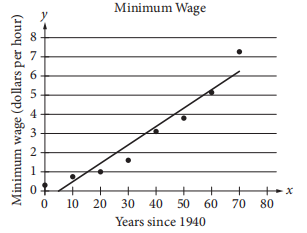
The scatterplot above shows the federal-mandated minimum wage every 10 years between 1940 and 2010. A line of best fit is shown, and its equation is y = 0.096x - 0.488. What does the line of best fit predict about the increase in the minimum wage over the 70-year period?
Options
A
Each year between 1940 and 2010, the average increase in minimum wage was 0.096 dollars.
B
Each year between 1940 and 2010, the average increase in minimum wage was 0.49 dollars.
C
Every 10 years between 1940 and 2010, the average increase in minimum wage was 0.096 dollars.
D
Every 10 years between 1940 and 2010, the average increase in minimum wage was 0.488 dollars.
Answer & Analysis
Click "Show Answer" to reveal the answer and analysis
Want More Practice Questions?
Access thousands of practice questions with detailed explanations on Scholardog.
Practice Now - It's Free!