Question #6402688Single Choice
Math
Question
Questions 21 and 22 refer to the following information.
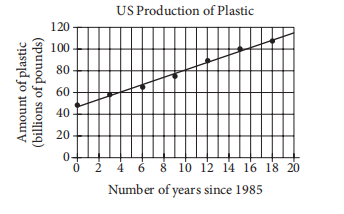
Between 1985 and 2003, data were collected every three years on the amount of plastic produced annually in the United States, in billions of pounds. The graph below shows the data and a line of best fit. The equation of the line of best fit is , where x is the number of years since 1985 and y is the amount of plastic produced annually, in billions of pounds.
21
Which of the following is the best interpretation of the number 3.39 in the context of the problem?
Between 1985 and 2003, data were collected every three years on the amount of plastic produced annually in the United States, in billions of pounds. The graph below shows the data and a line of best fit. The equation of the line of best fit is
, where x is the number of years since 1985 and y is the amount of plastic produced annually, in billions of pounds.21
Which of the following is the best interpretation of the number 3.39 in the context of the problem?
Options
A
The amount of plastic, in billions of pounds, produced in the United States during the year 1985.
B
The number of years it took the United States to produce 1 billion pounds of plastic
C
The average annual plastic production, in billions of pounds, in the United States from 1985 to 2003
D
The average annual increase, in billions of pounds, of plastic produced per year in the United States from 1985 to 2003
Answer & Analysis
Click "Show Answer" to reveal the answer and analysis
Want More Practice Questions?
Access thousands of practice questions with detailed explanations on Scholardog.
Practice Now - It's Free!