Question #6402685Single Choice
Math
Question
The figure below shows the relationship between the percent of leaf litter mass remaining after decomposing for 3 years and the mean annual temperature, in degrees Celsius (°C), in 18 forests in Canada. A line of best fit is also shown.
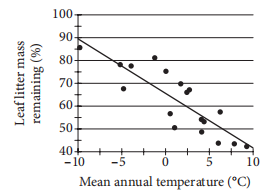
A particular forest in Canada, whose data is not included in the figure, had a mean annual temperature of −2°C. Based on the line of best fit, which of the following is closest to the predicted percent of leaf litter mass remaining in this particular forest after decomposing for 3 years?
A particular forest in Canada, whose data is not included in the figure, had a mean annual temperature of −2°C. Based on the line of best fit, which of the following is closest to the predicted percent of leaf litter mass remaining in this particular forest after decomposing for 3 years?
Options
A
50%
B
63%
C
70%
D
82%
Answer & Analysis
Click "Show Answer" to reveal the answer and analysis
Want More Practice Questions?
Access thousands of practice questions with detailed explanations on Scholardog.
Practice Now - It's Free!