Question #6402677Single Choice
Math
Question
Water pours into the glass slowly and at a constant rate. Which of the following graphs best illustrates the height of the water level in the glass as it fills?
Options
A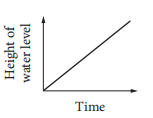
B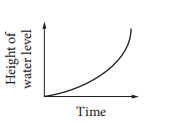
C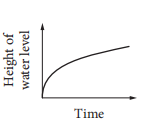
D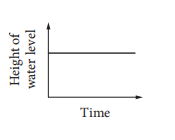
Answer & Analysis
Click "Show Answer" to reveal the answer and analysis
Want More Practice Questions?
Access thousands of practice questions with detailed explanations on Scholardog.
Practice Now - It's Free!