Question #6402606Single Choice
Math
Question
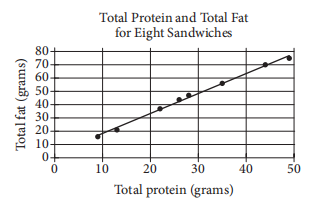
The scatterplot above shows the numbers of grams of both total protein and total fat for eight sandwiches on a restaurant menu. The line of best fit for the data is also shown. According to the line of best fit, which of the following is closest to the predicted increase in total fat, in grams, for every increase of 1 gram in total protein?
Options
A
2.5
B
2.0
C
1.5
D
1.0
Answer & Analysis
Click "Show Answer" to reveal the answer and analysis
Want More Practice Questions?
Access thousands of practice questions with detailed explanations on Scholardog.
Practice Now - It's Free!