Question #6402508Single Choice
Math
Question
The scatterplot below shows the amount of electric energy generated, in millions of megawatt-hours, by nuclear sources over a 10‑year period.
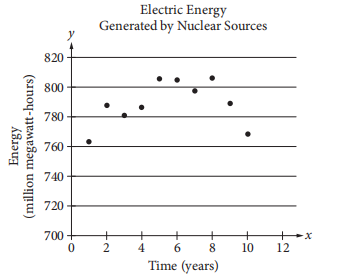
Of the following equations, which best models the data in the scatterplot?
Of the following equations, which best models the data in the scatterplot?
Options
A
B
C
D
Answer & Analysis
Click "Show Answer" to reveal the answer and analysis
Want More Practice Questions?
Access thousands of practice questions with detailed explanations on Scholardog.
Practice Now - It's Free!