Question #6402396Single Choice
Math
Question
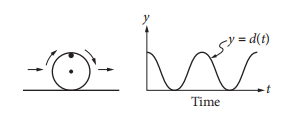
The figure on the left above shows a wheel with a mark on its rim. The wheel is rolling on the ground at a constant rate along a level straight path from a starting point to an ending point. The graph of
 on the right could represent which of the following as a function of time from when the wheel began to roll?
Options
A
The speed at which the wheel is rolling
B
The distance of the wheel from its starting point
C
The distance of the mark on the rim from the center of the wheel
D
The distance of the mark on the rim from the ground
Answer & Analysis
Click "Show Answer" to reveal the answer and analysis
Want More Practice Questions?
Access thousands of practice questions with detailed explanations on Scholardog.
Practice Now - It's Free!