Question #6402377Single Choice
Math
Question
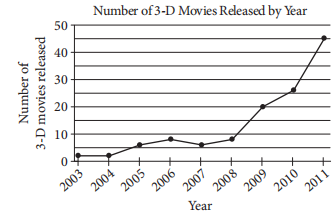
According to the line graph above, between which two consecutive years was there the greatest change in the number of 3‑D movies released?
Options
A
2003 - 2004
B
2008 - 2009
C
2009 - 2010
D
2010 - 2011
Answer & Analysis
Click "Show Answer" to reveal the answer and analysis
Want More Practice Questions?
Access thousands of practice questions with detailed explanations on Scholardog.
Practice Now - It's Free!