Question #6402199Single Choice
Math
Question
The relative housing cost for a US city is defined to be the ratio  , expressed as a percent.
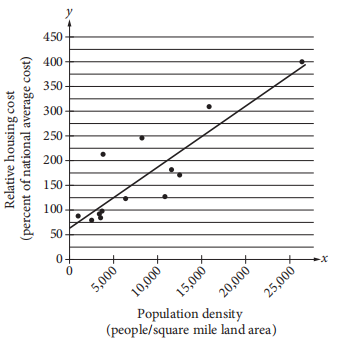
, expressed as a percent.
The scatterplot above shows the relative housing cost and the population density for several large US cities in the year 2005. The line of best fit is also shown and has equation y = 0.0125x + 61. Which of the following best explains how the number 61 in the equation relates to the scatterplot?
Options
A
In 2005, the lowest housing cost in the United States was about $61 per month.
B
In 2005, the lowest housing cost in the United States was about 61% of the highest housing cost.
C
In 2005, even in cities with low population densities, housing costs were never below 61% of the national average.
D
In 2005, even in cities with low population densities, housing costs were likely at least 61% of the national average.
Answer & Analysis
Click "Show Answer" to reveal the answer and analysis
Want More Practice Questions?
Access thousands of practice questions with detailed explanations on Scholardog.
Practice Now - It's Free!