Question #6402195Single Choice
Math
Question
The tables below give the distribution of high temperatures in degrees Fahrenheit (°F) for City A and City B over the same 21 days in March.
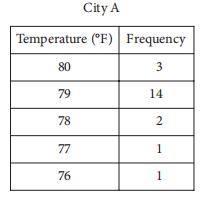
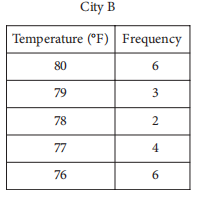
Which of the following is true about the data shown for these 21 days?
Which of the following is true about the data shown for these 21 days?
Options
A
The standard deviation of temperatures in City A is larger.
B
The standard deviation of temperatures in City B is larger.
C
The standard deviation of temperatures in City A is the same as that of City B.
D
The standard deviation of temperatures in these cities cannot be calculated with the data provided.
Answer & Analysis
Click "Show Answer" to reveal the answer and analysis
Want More Practice Questions?
Access thousands of practice questions with detailed explanations on Scholardog.
Practice Now - It's Free!