Question #6402193Single Choice
Math
Question
Questions 21 and 22 refer to the following information.
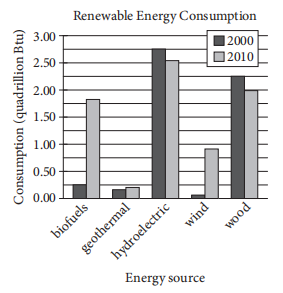
The bar graph above shows renewable energy consumption in quadrillions of British thermal units (Btu) in the United States, by energy source, for several energy sources in the years 2000 and 2010.
21
In a scatterplot of this data, where renewable energy consumption in the year 2000 is plotted along the x-axis and renewable energy consumption in the year 2010 is plotted along the y-axis for each of the given energy sources, how many data points would be above the line y = x?
Options
A
1
B
2
C
3
D
4
Answer & Analysis
Click "Show Answer" to reveal the answer and analysis
Want More Practice Questions?
Access thousands of practice questions with detailed explanations on Scholardog.
Practice Now - It's Free!