Question #6402192Single Choice
Math
Question
The mass of living organisms in a lake is defined to be the biomass of the lake. If the biomass in a lake doubles each year, which of the following graphs could model the biomass in the lake as a function of time? (Note: In each graph below, O represents (0, 0).)
Options
A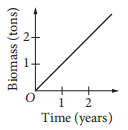
B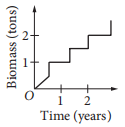
C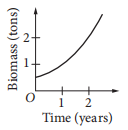
D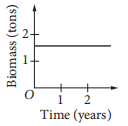
Answer & Analysis
Click "Show Answer" to reveal the answer and analysis
Want More Practice Questions?
Access thousands of practice questions with detailed explanations on Scholardog.
Practice Now - It's Free!