Question #6402090Single Choice
Math
Question
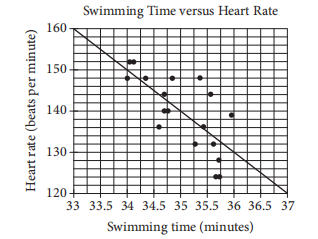
Michael swam 2,000 yards on each of eighteen days. The scatterplot above shows his swim time for and corresponding heart rate after each swim. The line of best fit for the data is also shown. For the swim that took 34 minutes, Michael’s actual heart rate was about how many beats per minutes less than the rate predicted by the line of best fit?
Options
A
1
B
2
C
3
D
4
Answer & Analysis
Click "Show Answer" to reveal the answer and analysis
Want More Practice Questions?
Access thousands of practice questions with detailed explanations on Scholardog.
Practice Now - It's Free!